|
|
Tutorial - Part 1: Our First Model Point Test
The Result
If no error occured, CheckMATE should have produced an output similar to the following:
Test: Calculation of r = signal/(95%CL limit on signal)
Warning: Error is dominated by Monte Carlo statistics!
Result: Excluded
Result for r: r_max = 2.26123
SR: atlas_conf_2013_047 - EM
Let us understand these lines one by one:
- As explained before, in the standard setup CheckMATE compares the model prediction to the upper limit by calculating r.
- One usually should provide the systematical uncertainty on the input cross section, which is taken into account in the limit setting by CheckMATE. If the input event file contains so
few events that dS_stat is larger than dS_sys, CheckMATE informs the user. Providing more statistics can improve the limits in those cases. However, we set the theoretical
error to 0 and therefore we will always be dominated by statistics, so we can ignore the warning.
- The most important information is told in the Result line, which tells us whether the input model point is excluded or allowed.
- The r-value which was used to find the result is given here. If r is larger than 1 it means that one predicts more than is allowed.
- The most sensitive signal region (according to the prescription explained on the previous page) that set the limit is given as well.
| 
|
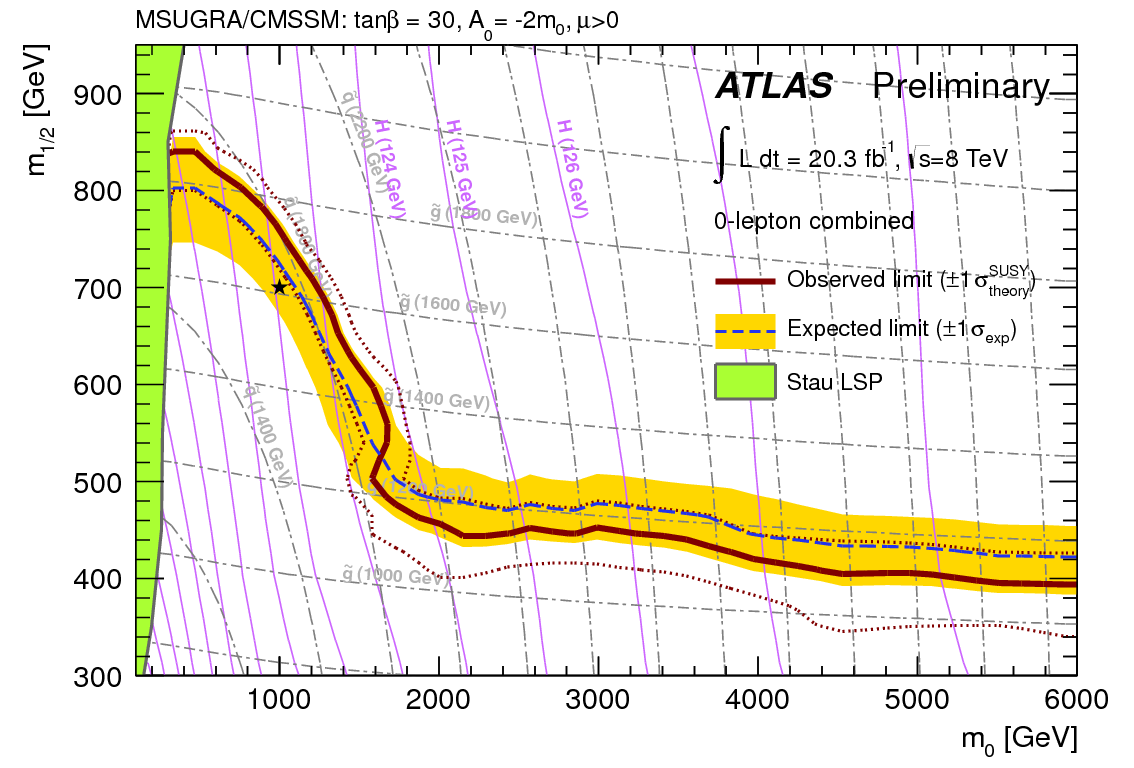
Check out the exclusion limit ATLAS quotes for the same analysis using the same model. Does our answer agree?

[Show Answer]The red line shows the observed limit and everything below is excluded by the LHC. Our considered model point was m0 = 2 TeV, m12 = 350 GeV (see first page of this tutorial), which is clearly excluded in this diagram. |
Note that due to the limited disk space on the virtual machine we could only create a rather small sample. Since CheckMATE uses the statistical error to weaken its exclusion statement (remember the numerator S-1.96 dS in r), it will produce weaker limits if the statistics is poor. Fortunately, the model point we considered was such that this effect still lead to excluded. However, if we tried to reproduce the precise exclusion line with r=1, we would need more simulated events to find agreement.
Click to finish exercise 1.
|

